


Source: XKCD
The InformEd team spent last week in Cleveland, Ohio attending the American Evaluation Association (AEA) conference. If you haven’t had a chance to check out the AEA, I highly recommend it. It’s a great conference and I promise that you will leave with new skills, ideas, and perspectives. I first attended AEA in 2013. I still remember sitting in on my first data visualization presentation. I hadn’t given much thought to data visualization up until that point and then it dawned on me – a chance to combine creativity with data. More importantly, a way to keep attention and effectively communicate complex topics.
Flash forward to tonight, the discussions from AEA are swirling in my head, I’m coming off a 2-day workshop on Communicating Data Effectively with the very impressive and inspiring Stephanie Evergreen, and I’m watching the mid-term election results. Graphs and statistics are flying across the screen as pundits analyze incoming results.
While InformEd works in international development, it’s beneficial for us to learn from other data folks. Elections provide us with a unique opportunity to look at how different media outlets are communicating the same results. Let’s look at some of the best and worst data visualizations on election night.
Control of the House: Icon Arrays and Aggregated Bar Charts

Screenshot of the live feed from CNN.
The main story of the night was around control of the House. Icon Arrays seemed to be the visualization of choice – each dot representing one representative. CNN had their icon array at an angle, which makes it hard to for the human mind to judge size and comparisons. I had to pause this image to fully to comprehend all the information it was presenting - 7 different color hues, based on probability of various house races, mapped on an angled icon array. This is where things often get complicated with political data – there’s a desire to map likelihood / probability alongside results. Plus, it seems all the news outlets are trying to out-do their competitors with flashier, fancier graphics. Forget any consideration of whether the visualizations are effective or not.
Vox decided to keep things simple and set aside probabilities in their House icon array. I found myself checking their icon array throughout the night which was a simple representation of which seats went Democratic and which went Republican. Helping to ground the icon array, they had an aggregated bar chart which served as a simple, easy-to-interpret graph when the icon array got a bit dicey. Check out how the icon array got difficult to judge as the night went on – and how the aggregated bar chart helped clear it up.

While the clip above from CNN is from their television broadcast, they did keep things simple on their website. They also adopted an aggregated bar chart, for both the Senate and the House races, which updated throughout the night. They used the check mark icons to show their projections, which made sense if you were like me – watching TV and checking all the news outlets online, but otherwise wasn’t all that intuitive.

Gauge Charts
Gauge charts are a favorite in the political arena. In other sectors (including the international development sector), they often are criticized. You’ve heard it before, the curved angle is hard to judge, it takes up a lot of space – for just one number. However, for politics, they are everywhere. Perhaps it’s because the gauge needle trembles, kind of like your nerves while watching election results stream in.
Last night, almost every site I was checking had some sort of gauge chart. Some worked. Some didn’t. Some just stressed me out.

Probability Meter presented on Fox News.
Fox News displayed their Probability Meter front and center on their website through the election night. There was a small button that allowed you click for methodology with I, as one of the rare people who digs that, appreciated. The other 99% of the population could ignore this entirely. Also good. But their probability meter had a few major issues. Firstly, no where did it explain the meaning of red and blue. Sure, most people know this – but I’m always surprised how many folks don’t. Furthermore, you had to think one step further than the graph showed – the large percentage in the center of the gauge was the probability of control being either red (if that’s where the gauge was) or blue (if that’s where the gauge was). I deal with data regularly and had to think twice about it.

Picture of my television screen, which I had tuned to MSNBC all night.
MSNBC also had a jittering gauge that they visited occasionally throughout their programming. It was a bit easier to understand because they had labels along the gauge, referencing likelihood of democratic or republican control. On top of that, though, they had a huge number on the side. Their message was clear. Now, we can have the debate of whether ‘chance’ and ‘probability’ is intuitive for folks – but hey, it’s an improvement on Odds Ratios and Risk Ratios (any epidemiologists out there?).

Screenshot of the New York Times mobile app.
I thought the New York Times did the best gauge of the evening. The image is a snapshot from my phone, which was clear and simple to read. The labeling of the graph, coupled with a clear and simple title/take-away message made it an effective communication tool. Setting aside probabilities, I actually liked the NY Times’ use of the gauge to display House Composition the most. We know that the gauge being straight up is equal. The gauge on either side shows majority composition. As the night went on, it slowly fell to the left (to the democrats). Cool!
The In-N-Out Burger of Data Visualization
Leave it to Nate Silver and FiveThirtyEight to up the ante on data visualization. Firstly, can I just point out their super cool ‘How do you like your Senate forecast?’ menu? It’s awesome. How do you tailor statistics and messaging to all the various stakeholders that might stumble across your website? Especially Americans? This way. With burgers.

Burger (data) choices on FiveThirtyEight.
They avoided all gauges but instead used bar charts and shaded coloring to show probabilities. Deviation bars helped explain their points – narrowing down on the fact that all most people cared about was the likelihood of each party taking control of the Senate (shown here) or the House.

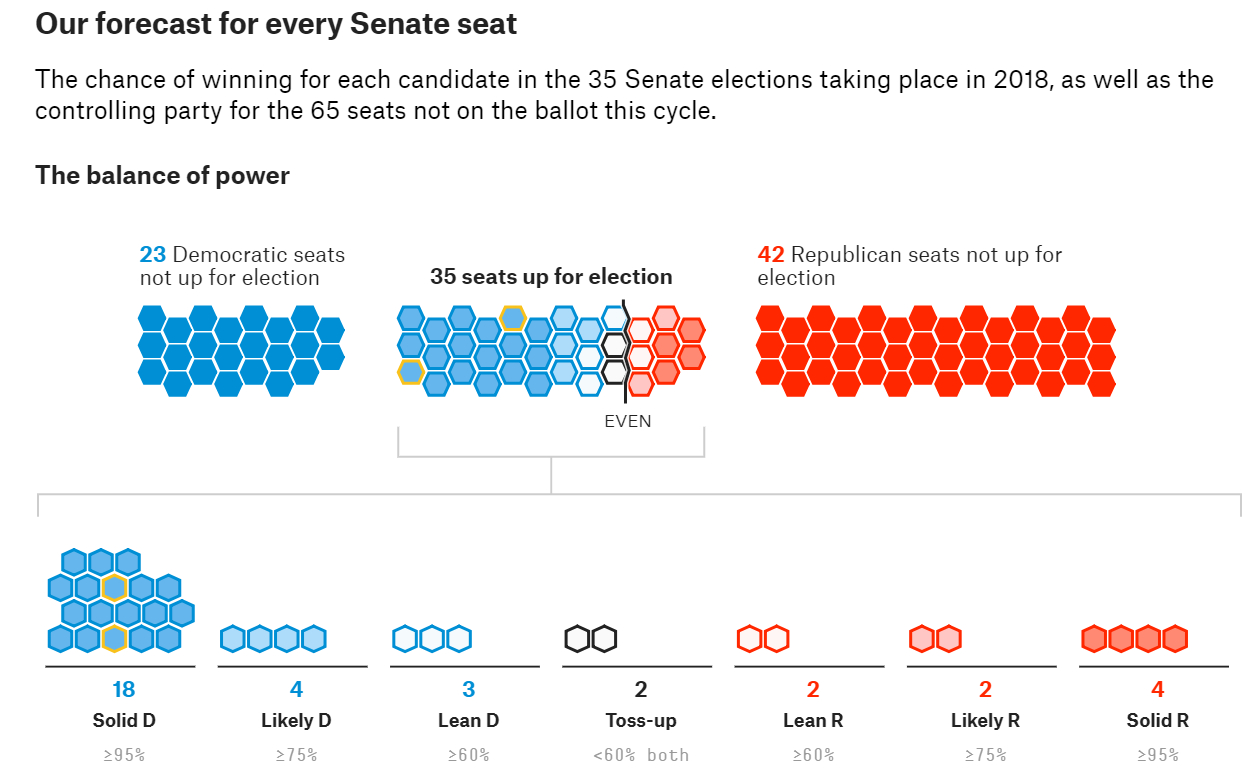
Another great way they displayed data was using a tile map. See how simply they provided the big picture: all 100 seats. Then easily and clearly breaking down the 35 seats in question last night. Of those, you can see probabilities of each seat, clearly separated and grouped by probability groups. Easily digestible yet packing tons of complex and rich information. Want to know the specifics of each state? Put it on a map!

Keeping it Simple
At the end of the night, I was ready to set aside probabilities. I was having flashbacks of the 2016 election, where probabilities and proportions led me astray. I just wanted to know what was happening in races I cared about. For a particular race, I wanted to know 3 things: the proportion of people voting for each candidate and the proportion of votes accounted for at that point in the race. Thank you, Google for making this super easy.


Worth Checking Out
Once most polls had closed and the results of the evening settled, people started putting together some awesome data visualizations to help us process results. Check out these resources which use effective data visualization strategies (simplicity, excellent chart choice for data types) to communicate their messages.
The LA Times put out this great page praising what the night meant for women.
Were you watching for the blue wave? Did it come? Or was it just a ripple? The Guardian put together this awesome map. By far the best analysis and visualization of the blue wave that I’ve seen. You can check out the entire article here.

Visualization of the blue wave presented by The Guardian.
We hope to use these visualizations as inspiration for some of our projects moving forward. How will you be using them?