

Indices like the Human Development Index (HDI) or the even-better Inequality-Adjusted Human Development Index (IHDI) are developed to set benchmarks for improving the lives of a specific population. Indices are popular because they allow country-to-country comparisons and sum up simpler measurements into one single number. Perhaps it is for this reason that composite indicators have gained astounding popularity in all areas of research.1 In a world with increasing access to data, indices serve a purpose: to allow for complex concepts to be conceptualized in a single data point and compared across different contexts.
It was with this in mind that we created the Girls’ Opportunity Index in partnership with World Vision. World Vision sought to explore the relationship between the opportunities a girl was provided and child marriage rates. The activity involved only secondary national-level data and the creation of an index seemed perfect to all for country-to-country comparisons.
Below are the steps we used to create an index that captured a girls’ opportunity.
1) Identify the domains of interest. In other words, what components or main constructs best describe the variable of interest?
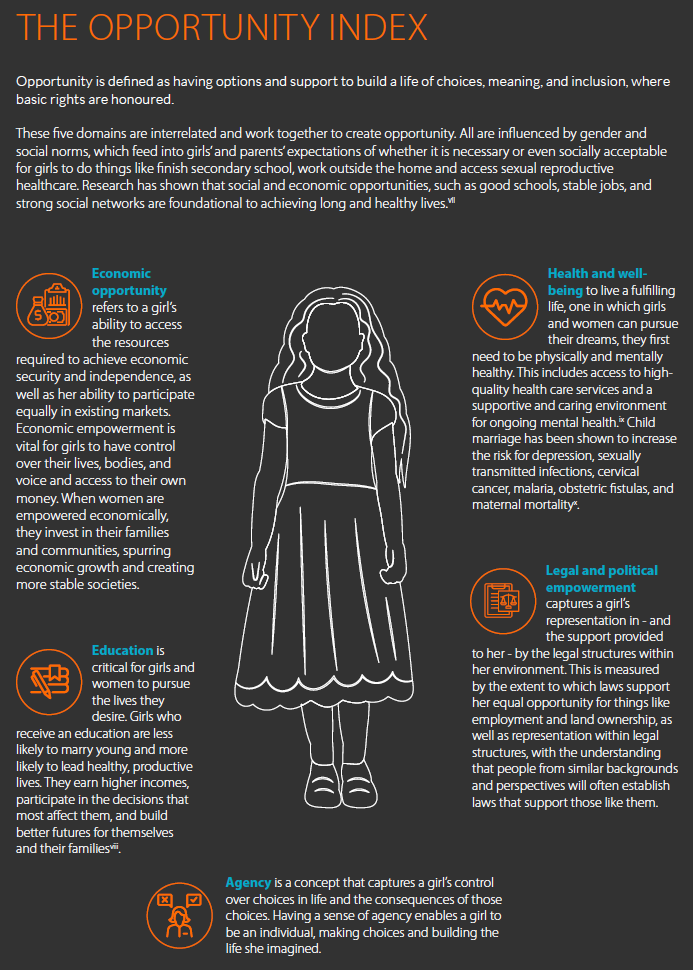
For the opportunity index, we reviewed literature and discussed the topic with technical experts to identify the following 5 domains which best captured the concept of ‘opportunity’:
Education
Health & Well-being
Economic Empowerment
Agency
Legal and political inclusion
World Vision International. (2022). Fighting for a Future - girls' opportunities.
2) Identify measures that best capture each domain.
After reviewing globally-available data, we identified the following indicators for each of the domains. Indicators were identified and reviewed based on relation to/representation of the domain and availability of data.
Opportunity Index Domains, Indicators, and Data Source
| Domain | Indicator | Data source |
|---|---|---|
| Economic Empowerment | Labor force participation rate (% female population aged 15+) | International Labor Organization, ILOSTAT database |
| Proportion of adults (15 years and older) with an account at a bank or other financial institution or with a mobile-money service-provider | Global Financial Inclusion (Global Findex) database | |
| Proportion of women in managerial positions | International Labor Organization, ILOSTAT database | |
| Percentage of children aged 36-59 months attending an early childhood education program. | UNICEF State of the World’s Children | |
| Educational Attainment | SDG 4.1.2. Completion rate, secondary education by sex | UNESCO Institute for Statistics |
| Youth/adult literacy rate – 15 years and above | Demographic and Health Surveys, UNICEF Multiple Indicator Cluster Surveys | |
| Government expenditure on education, total (% of GDP) | World Bank Data | |
| Health and Wellbeing | Maternal mortality ratio | World Health Organization |
| Adolescent birth rate (aged 15–19 years) per 1,000 women in that age group | United Nations Statistics Division | |
| Proportion of ever-partnered women and girls aged 15 years and older subjected to physical, sexual or psychological violence by a current or former intimate partner | Domestic Violence Module Demographic and Health Surveys, Crime Victimization Surveys | |
| Agency | Participation of women in household decision-making index | DHS |
| Access to sexual and reproductive health and reproductive rights | DHS, MICS, Generations and Gender Surveys | |
| Proportion of women ages 15 years and older who report having a mobile phone that they use to make and receive personal calls | Gallup World Poll 2017 | |
| Legal and Political Inclusion | Proportion of seats held by women in national parliaments | Inter-parliamentary union |
| Proportion of laws and regulations having gender equality for entrepreneurship and employment, disaggregated by type of law | Based on the Women, Business, and the Law database, a World Bank Group product |
3) For each domain, create a single, normalized value.
Since there are varying indicators and different scales (rates, ratios, percentages) for each indicator within a domain, the first step was to create one value between 0 and 1 for each domain within a country. Normalization was carried out using the following formula: xn = (X-Min)/(Max-Min) or xn = (X-Max)/(Min-Max), depending on the direction of the indicator. This was done to ensure that the direction of the normalization aligned with lower numbers representing less opportunity and larger numbers representing greater opportunity.
4) Combine the domains into an indicator.
In this case, we had 5 domains that had been normalized and needed to be combined into a single indicator. Since we decided that all domains had equal weights, this composite index was created by taking the average of the 5 domains for each country.
5) Communicate the index effectively.
The overall index can be compared across countries, but it is also interesting to compare the domain across countries. We did this through a stacked bar chart that shows which domains most significantly contributed to the index within a given country.

Now you can use your new index to explore relationships and trends across countries, regions, or with other variables. For example, we looked at the correlation between the index and child marriage rates within each country.
Interested in seeing what we learned? You can explore the findings in the published report.
1 https://link.springer.com/article/10.1007/s11205-017-1832-9